Spacegraphcats parameters
There are two parameters that control the behavior of spacegraphcats: k-mer size (k) and radius size (r). Both of these parameters are specified in the config file. We have tested spacegraphcats behavior most extensively with a k-size = 31 and radius = 1, but below we explore how these parameters behave with different values in real metagenomes. As we have not exhaustively tested different parameters, below we discuss the role of these parameters in changing spacegraphcats outputs in the context of a variety of sequencing data. Our goal is to help the user build an intuition for the behavior of these parameters and how they may impact spacegraphcats output in the context of different sequencing data.
K-mer size
The k-mer size is used to build the compact de Bruijn graph (cDBG, e.g. assembly graph). Smaller k-mer sizes will collapse more sequences together. This can be seen in a supplemental graph from the Bandage publication, included below. On the far left, the graph is built with a k-mer size of 21 and appears as a denser component than the graph on the far right that is built with a k-merm size of 127.
 Source Wick et al. 2015
Most metagenome assemblers iteratively build assembly graphs with different k-mer sizes, and select the paths in the graphs that generate the longest/least branching paths to generate linear contigs. Spacegraphcats uses a single k-mer size to generate its cDBG. As is seen in the picture above, this will impact the topology of the cDBG.
We use a k = 31 as the "default" k-mer size in spacegraphcats. We selected this size because there is substantial k-mer overlap between genomes from the same species at a k-size of 31 (see the Metapalette paper for a larger discussion of sequence similarity between genomes at different k sizes.) Because of this overlap, it follows that k-mers from the same species would be graph-adjacent in the cDBG.
Note that there is substantial overlap between genomes of the same genus at a k-size of 21, and substantial overlap between genomes of the same strain at a k-size of 51.
Radius size
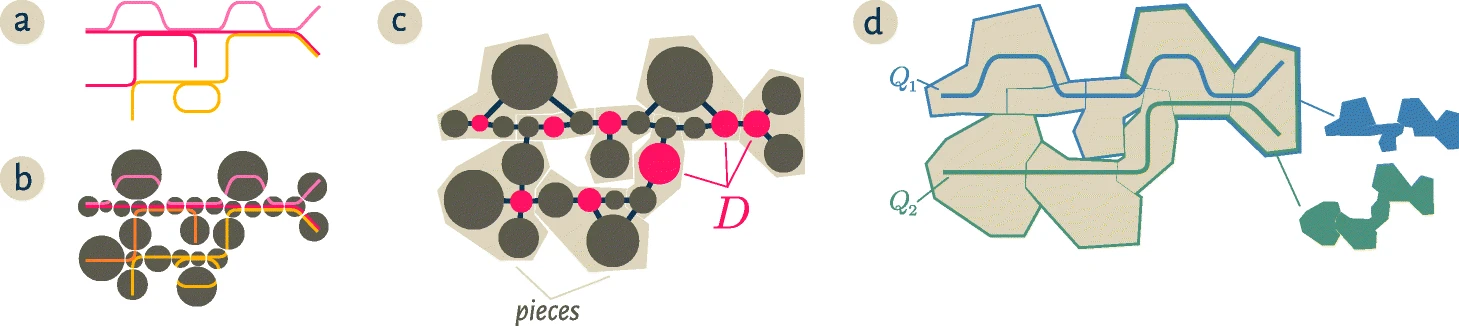
The radius size controls the maximum distance a node in the cDBG can be from a dominating node. The figure below is reproduced from the spacegraphcats paper. "Starting from a collection of genomic sequences (a), we form an assembly graph where nodes represent distinct linear subsequences (b). In this assembly graph, known as a compact De Bruijn graph, nodes may represent many k-mers. The original genomic sequences correspond to walks in the graph, and shared nodes between the walks represent shared subsequences. c We then identify a subset of nodes D called a dominating set so that every node in the assembly graph is at distance at most one from some member of D (marked pink). We further partition the graph into pieces by assigning every node to exactly one of the closest members of D (beige regions in c and d). For a genomic query Q, the neighborhood of Q in this graph is the union of all pieces which share at least one k-mer with the query. The colorful subsets of the pieces in d correspond to the neighborhoods of the queries Q1,Q2
 Source: Brown et al. 2020
In this figure, the dominating set has a radius = 1, where any node is at most distance 1 from a node in the dominating set. As the radius expands, the pieces "dominated" by each node in the dominating set will contain more nodes, and therefore more nucleotides.
The defaults: k = 31, r = 1
When using the "default" spacegraphcats parameters, relatively little k-mer sequence overlap is necessary between the query sequence and the query neighborhood to recover substantial portions of closely related genomes.
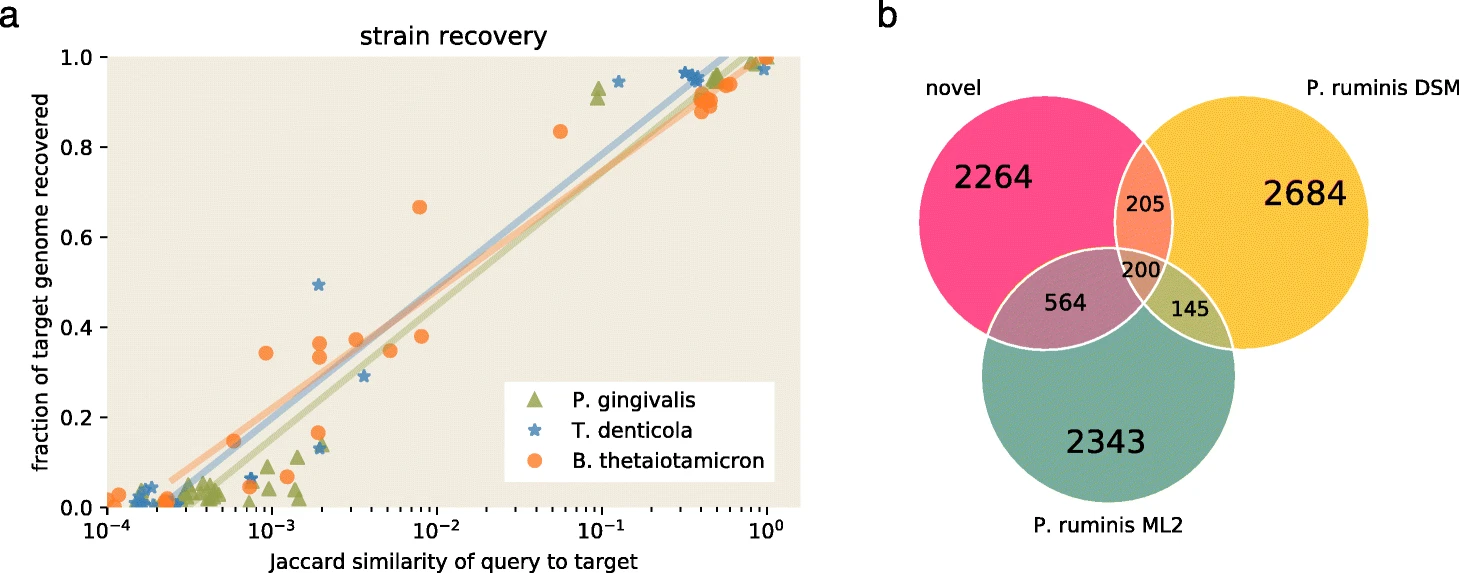
The figure below is reproduced from the spacegraphcats paper.
It demonstrates that with a Jaccard similarity between 10-2 and 10-3, 20-40% of a target genome sequence is recovered from a metagenome query.
This jumps to >80% when Jaccard similarity exceeds 10-1.
Panel B shows that an approximately 1 Mbp overlap between two genomes is sufficient to recover approximately 2.3 Mbp of unknown sequence from the closely related Proteiniclasticum genomes.
 Source: Brown et al. 2020
Below, we show an approximate conversion between Jaccard similarity and Average Nucleotide Identity (ANI) at different k-mer sizes using simulated sequences (notebook here). A Jaccard similarity of 0.10 corresponds approximately to 95% ANI at a k-mer size of 31.
 Image courtesy of Tessa Pierce Ward.
Do unwanted sequences sneak in, especially at larger radius sizes?
Generally speaking, we have not found that spacegraphcats genome queries on real metagenomes on catlases built with a k-size of 31 and a radius of 1 accidentally scoop in extra k-mers from the wrong taxonomy, but we have not tested this systematically.
Anecdotally:
- When we queried into ~600 human stool metagenomes using a genome sequence from Rumminococcus gnavus and with parameters k = 31 and r = 1, running strainphlan on the resulting query neighborhoods indicated that only R. gnavus was present.
- Using the same query neighborhoods described above, running singleM demonstrated that some query neighborhoods contained reads from marker genes consistent with different taxonomic ranks. Singlem searches reads for 14 marker genes, and assigns taxonomy to a sample based on those marker genes. Given that there is more likely to be shared k-mers in conserved single copy marker genes, it is possible that spacegraphcats pulls in some reads from these conserved regions.
- Using a gene of interest as a query, query neighborhoods often contain variation for that gene, as well sequences for upstream genes that are typcially co-located in a genome (e.g. querying with gyrA leads to the paritial recover of gyrB).
Querying a metagenome with a "complete" metagenome assembled genome
Metagenome assembled genomes are composite genomes comprising fragmented genome sequences from closely related genomes in a community. Generally, these genomes are highly fragmented due to assembly errors that arise from, among other things, strain variation and shallow sequencing coverage. "Complete" metagenome assembled genomes (CMAGs) are circularized metagenome assembled genomes with no gaps (see Chen et al. 2020). In multi-species communities, there are likely specific ecoevolutionary conditions that lead to sequencing data that allow the potential recovery of a CMAGs. For this to be possible, a genome likely needs to have very little strain variation, high abundance/coverage, and not be closely related to other genomes in the population.
Given these conditions, we were curious whether 1. CMAGs contain additional variation not captured by curation techniques, and 2. Using spacegraphcats to query a metagenome with a CMAG it precipitated leads to the recovery of "off target" sequences.
A Snakemake workflow is available for this analysis here.
After k-mer trimming the metagenome, we used a CMAG to query into the assembly graph.
We retrieved the reads for the query neighborhood and mapped these back to the CMAG assembly, and then retrieved unmapped reads.
99.82% of reads in the query neighborhood mapped back to the query, indicating there was little strain variation in the reads not accounted for in the assembly.
Using megahit, the unmapped reads assembled into 5 contigs ranging in size from 179-208bp.
When BLASTed (blastn, blastx) against the NCBI nr database, four of the five contigs matched 16S or 23S ribosomal RNA.
This likely indicates that sequences that are highly conserved between distantly related species may be included in spacegraphcats query neighborhoods; users should keep this in mind when asking biological questions about highly conserved sequences (e.g. ribosomal RNA).
The fifth sequence had no nucleotide matches, but matched a hypothetical protein
Candidatus Uhrbacteria bacterium RIFOXYA2_FULL_40_9.
This may indicate strain variation in these hypothetical protein sequence not captured in the CMAG.
 hypothetical protein A2239_02390 [Candidatus Uhrbacteria bacterium RIFOXYA2_FULL_40_9]
Sequence ID: OGL93914.1
Length: 354
Number of Matches: 1

Identical Proteins-Identical proteins to OGL93914.1
Range 1: 314 to 354
Alignment statistics for match #1 Score Expect  Method  Identities  Positives   Gaps    Frame
85.1 bits(209)  2e-17   Compositional matrix adjust.    41/41(100%)     41/41(100%)     0/41(0%)    -1

Query  201  SEEEQEAHWKLYEDSLAYLVAHPDEYRALNAVGLLEEFDWE  79
            SEEEQEAHWKLYEDSLAYLVAHPDEYRALNAVGLLEEFDWE
Sbjct  314  SEEEQEAHWKLYEDSLAYLVAHPDEYRALNAVGLLEEFDWE  354
Exploring taxonomy of cDBG nodes within dominators using a simple metagenome
Below we explore the taxonomy of spacegraphcats results using the experimental synthetic metagenome.
The metagenome was published by Shakya et al., 2013.
It contains sequences from isolate DNA that were aliquoted together prior to sequencing, so it is less complex than real community metagenomes.
Two of the genomes are different strains from the same species, and one of the genomes is a completely different class from the other two.
In spacegraphcats land, we refer to a subset of this data as twofoo.
The utility script explore-dominator-taxonomy.py
- Takes all sourmash hashes in the dataset and retrieves the cDBG unitig IDs to which they belong;
- It then aggregates those hashes under the dom nodes to which those cDBG unitigs belong;
- Finally, it calculates the taxonomy of the dom node based on the LCA of the hash values.
Below we show the taxonomy results when r = 1 and r = 5.
scripts/explore-dominator-taxonomy.py twofoo_k31_r1 twofoo_k31_r1_hashval_k31/index.pickle ../sourmash/podar-ref.lca.json.gz
Gives the following results:
88512 dom nodes have no sourmash hashes under them.
903 dom nodes have exactly one sourmash hash under them.
37 dom nodes have two or more sourmash hashes under them.

rank of dom node lca  count of dom nodes with that rank
--------------------  ---------------------------------
strain                  35
species                  2
What we see is that the graphs for the two different species are completely non-overlapping (at least at the resolution of sourmash k=31 scaled=1000) while the graphs for the genomes from the same strain are overlapping.
More specifically, 35 of the dom nodes have cDBG nodes with two or more hashvals under them that belong to the same strain, while only two of the dom nodes contain cDBGs with hashvals from the two different strains. At the resolution we're using here, the vast majority of cDBG nodes and dom nodes have no associated hashvals, which maybe says we should be using higher resolution sourmash or larger r!
Using a radius of 5:
loaded 27124 nodes from catlas twofoo_k31_r5
loaded 15031 layer 1 catlas nodes
loaded 9447551 k-mers in index (0.4s)
loaded 985 hash value -> cdbg_id mappings from twofoo_k31_r5_hashval_k31/index.pickle
14149 dom nodes have no sourmash hashes under them.
796 dom nodes have exactly one sourmash hash under them.
86 dom nodes have two or more sourmash hashes under them.

rank of dom node lca  count of dom nodes with that rank
--------------------  ---------------------------------
strain                  76
species                  10
The higher radius 'annotates' more dom nodes with taxonomy. In this example, there is still no increase in taxonomic confusion above the species level, which is good and expected for synthetic data.